The good old days of products been built to last is a relic of a time gone by according to a new study.
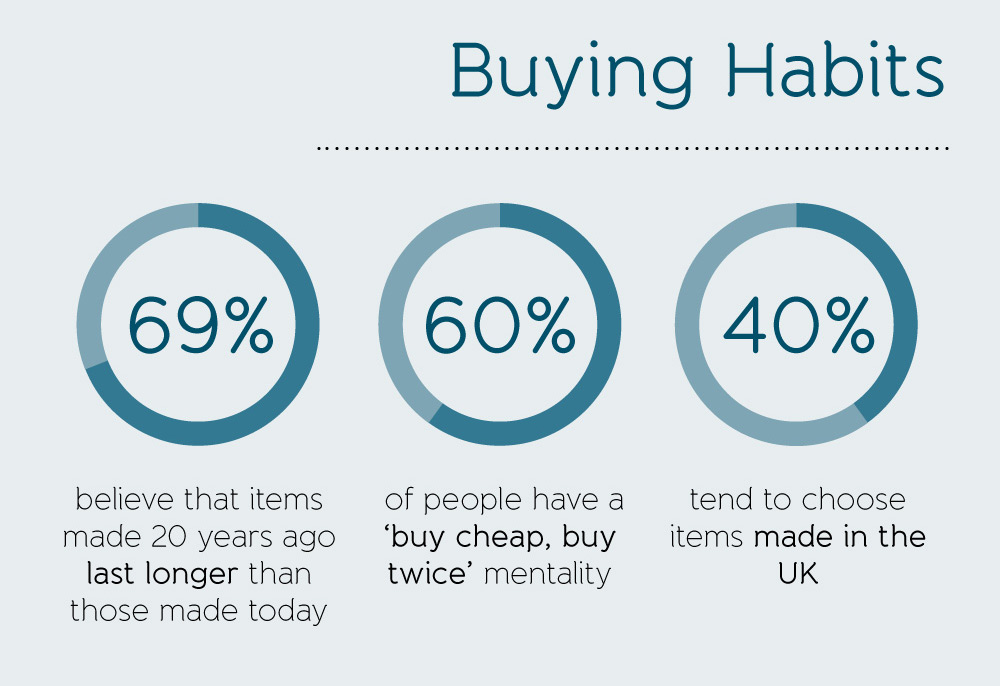
Only a third of modern purchases are ‘built to last’, and 69 per cent of Brits believe that items made 20 years ago last longer than products made today.
This has set a dangerous ‘throwaway’ culture, with the majority of Brits making purchases based on a ‘buy cheap, buy twice’ mentality.
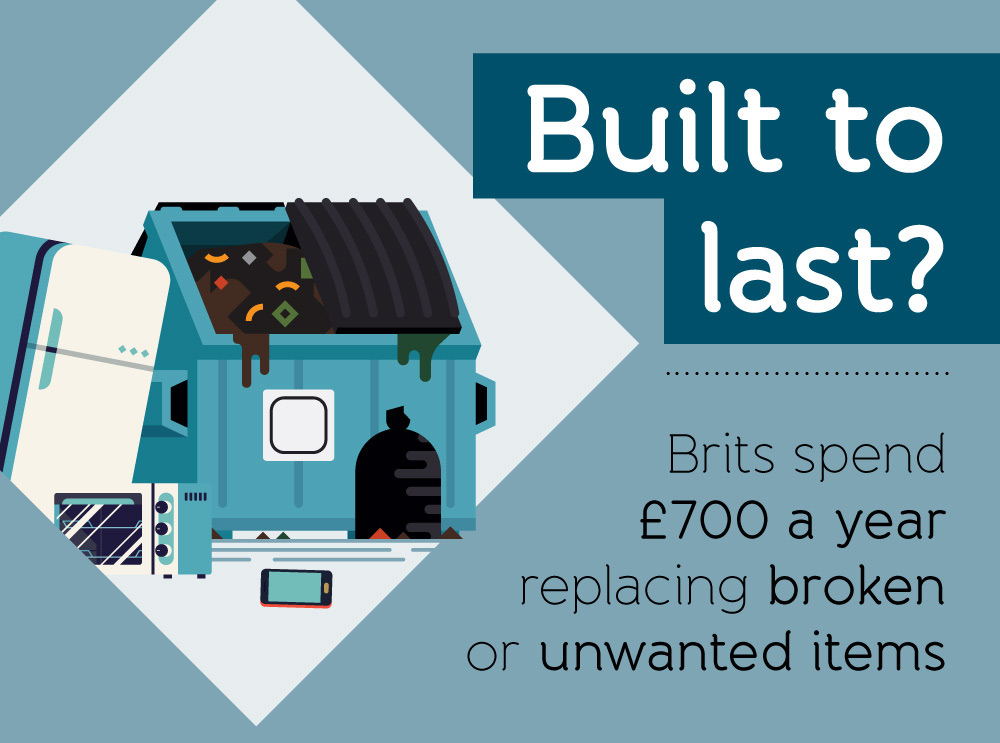
But skimping on quality is costing us a small fortune, with the average Brit throwing out almost £700-worth of broken or unwanted possessions every year.
Andrew Halsall, Managing Director of British manufacturer, Origin, who commissioned the survey, said “We live in a throwaway culture and are regularly bombarded with offers that can seem too tempting to pass up, but as the survey shows, buying cheap and cheerful isn’t always best.
“It is also increasingly rare to find products that will stand the test of time and the expectations of product lifespans are dropping.
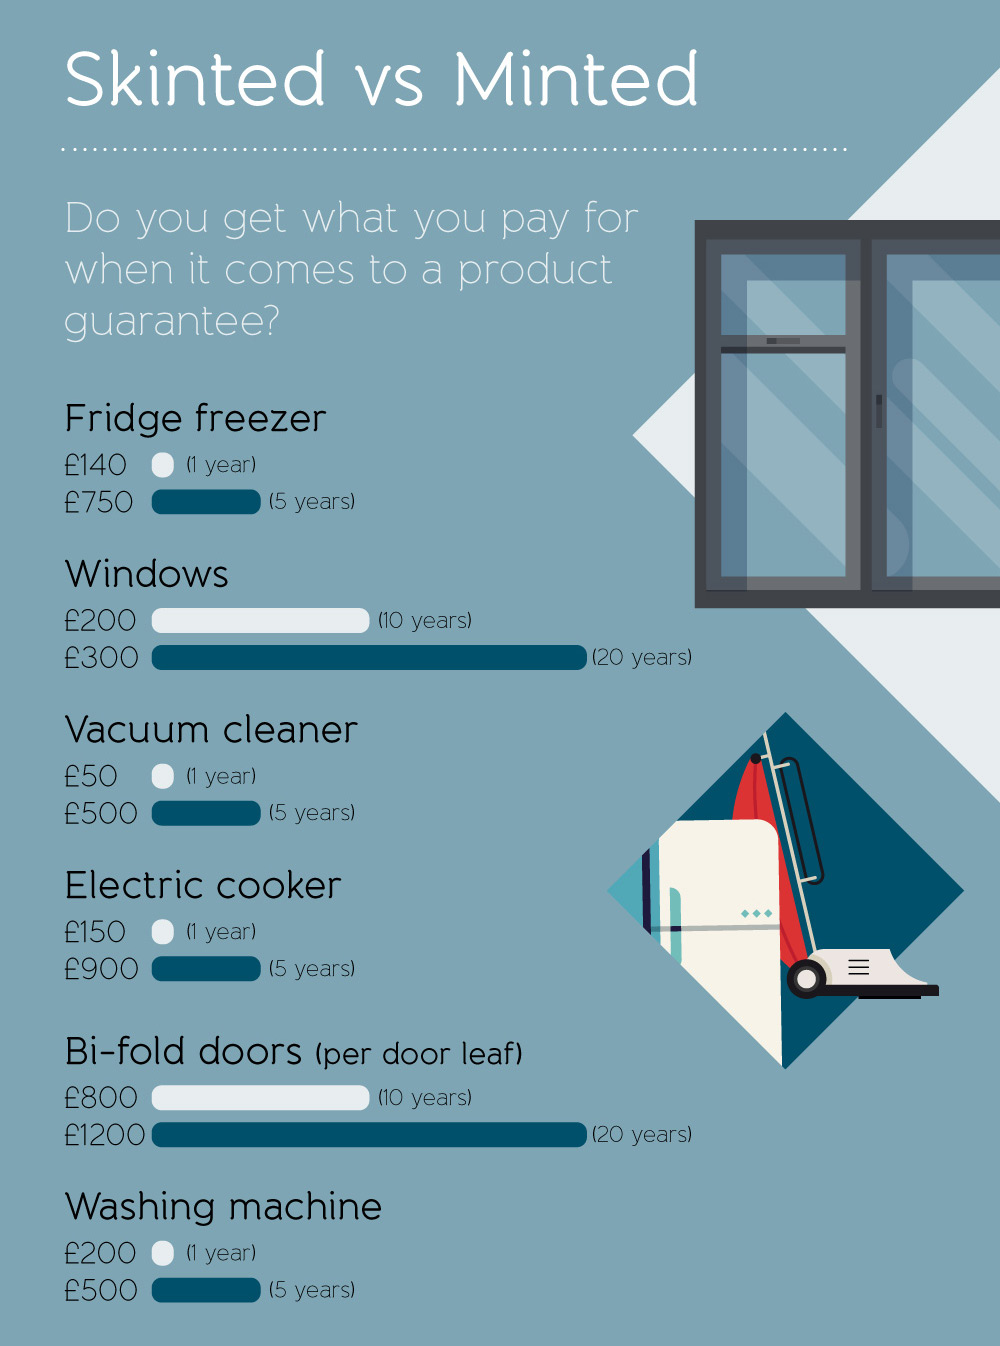
“The research also revealed the huge amount that we each spend replacing broken possessions and homewares, a figure that can be reduced dramatically if we choose high quality products with a longer manufacturer’s guarantee.”
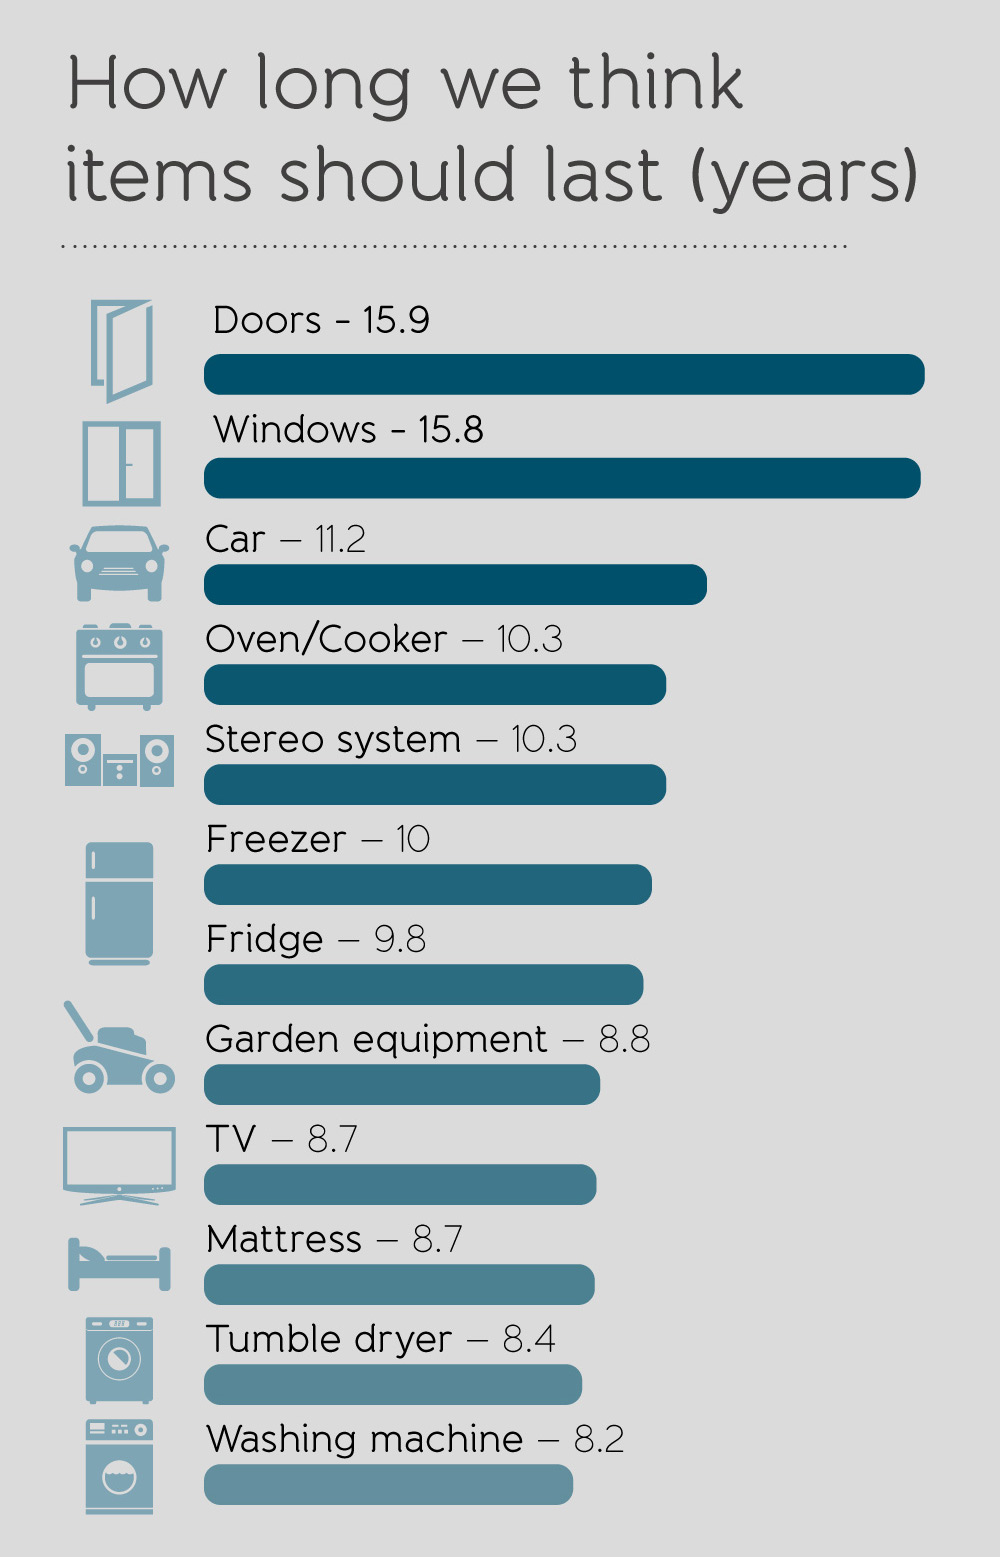
Results showed we expect our cars to have the longest life span of our purchases, coming in at an average of 11 years before a replacement is required. Putting in less impressive times are the burnt-out electric tooth brushes (four years), mobile phones (five years) and kettles (six years) heading for early retirement on the scrapheap.
Fridges, freezers and ovens are expected to last ten years apiece, while the dishwasher puts in a respectable eight years before calling it a day. The average home stereo is expected to pack in after a decade of use, while the springs start to come through our mattresses after nine years.
Home improvements are expected to last much longer, with a new kitchen or bathroom expected to last up to 13 years. We anticipate having to replace windows and doors in the home after less than 16 years, while UK residents would look to replace wooden flooring and carpets after 12 years.
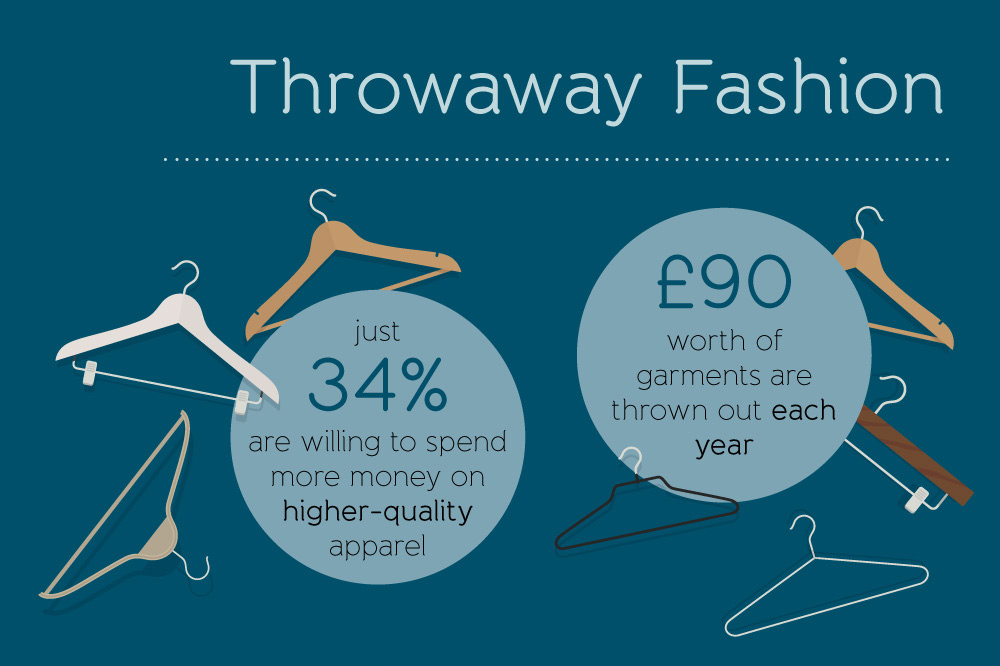
Fashion is throwaway for most young Brits; only 34 per cent are willing to spend more money on higher-quality apparel. When asked to estimate the value of the clothes they throw away annually, the average Brit reckons they chuck almost £90-worth of garments each year.
Fifty-nine per cent would describe themselves as ‘ruthless’ when it comes to chucking their belongings, with old clothes most likely to make the heap. The bin man will also collect £80-worth of furniture, £77-worth of electricals and £73-worth of home appliances from each Brit per year.
Almost half of Brits throw things away to clear space in their home, while a quarter falls out of love with their belongings as current styles change. One in seven get genuinely stressed out by their stuff and need to clean house regularly while an absent-minded 5 per cent confess to throwing their things away without really thinking about it.
When it comes to a high-quality build, 70 per cent of 18 to 35s think home appliances need to meet the gold standard, while 78 per cent of over 55s like their white goods to last. The 1,000 over 55s who were surveyed care more about build quality than younger generations but are less confident about fixing broken appliances and items themselves, with only 35 per cent willing to get stuck in with home maintenance.
Andrew Halsall continued: “It was encouraging to see that products made in Britain are regarded as much better quality, with 40 percent of people tending to choose items made here in the UK, which is why Origin wears its ‘made in Britain’ badge with pride.
“It’s interesting that cost and quality were most likely to influence the buying decision. However, for home items such as windows and doors that are built to last, we would always advise weighing up the initial cost against the lifespan of the product, as it’s often a no brainer to spend a little more from the start for a much longer lasting, better quality product.”



 Bitcoin
  Ethereum
  Tether
  XRP
XRP  Solana
  USDC
USDC  Cardano
  TRON
TRON  Lido Staked Ether
  Avalanche
  Toncoin