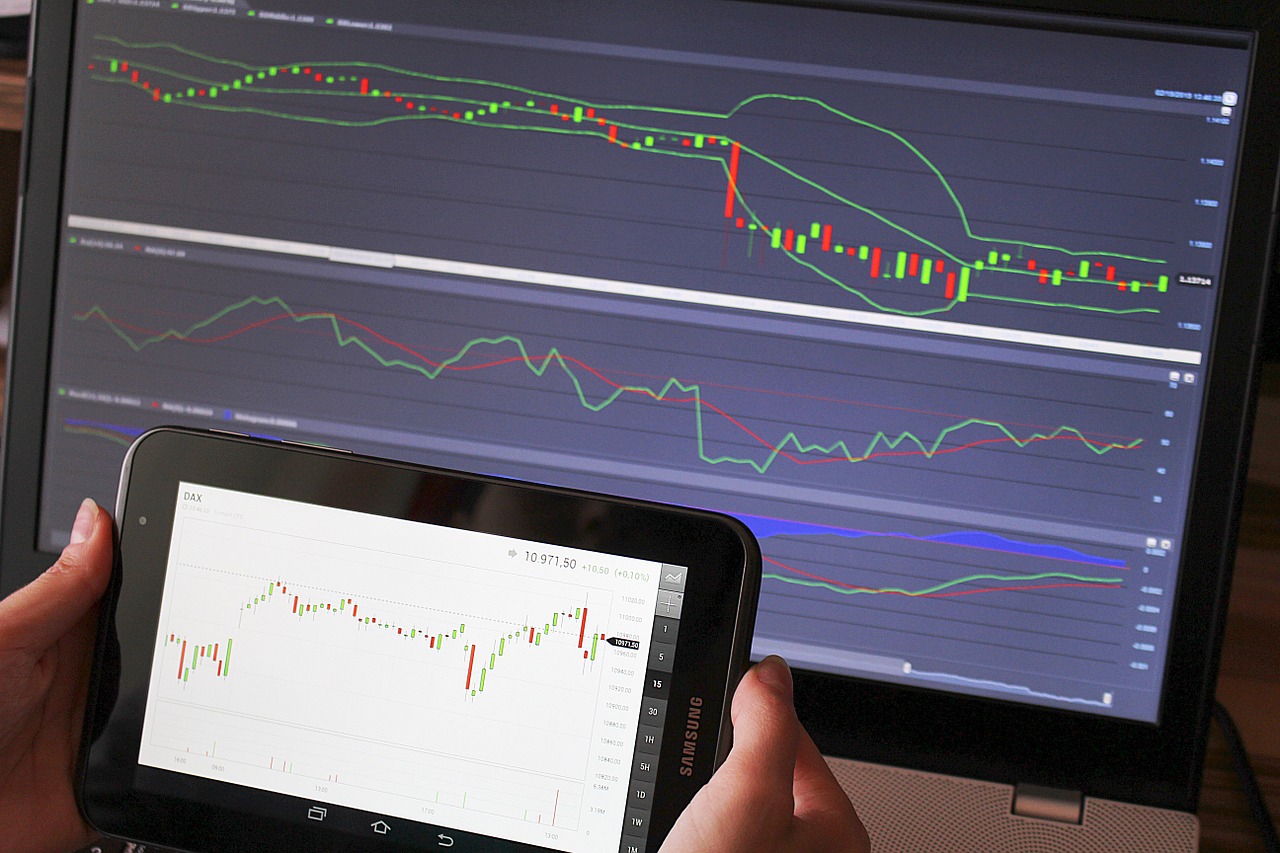
When you start your Forex trading journey, you will likely be swarmed with dozens of different trading methods. There are plenty of indicators available with compelling introductions, like learning algorithmic trading strategies, which can leave you confused as which trading idea is the best.
If you are stuck amidst options, this article may be useful to you. Below are the 3 most useful indicators in Forex trading.
1. Moving Average
The Moving Average is a trend-following indicator used by almost all Forex traders. Displayed on price charts as a line, it shows you the average price of an asset for a specific period of time.
The Moving Average’s main functions include:
- Smoothening the price action
- Identifying support and resistance levels
- Determining market trends
- Identifying changes in market sentiment
The Moving Average can work as an independent trend detecting tool or can be combined with an oscillator to create a complete trading system. In addition, you can use multiple Moving Averages to determine trends more accurately.
2. Relative Strength Index (RSI)
First introduced in 1978, the RSI is an oscillator (also known as a leading indicator) invented by a mechanical engineer named J.Welles Wilder. The indicator has quickly become famous for its accuracy and is now one of the most commonly used tools in Forex trading.
The RSI is represented by a line that moves in a range from 0 to 100. This indicator was originally designed to identify overbought or oversold conditions of an asset.
- When the RSI line crosses above 70, the price of the asset is considered overbought. That indicates upcoming downward reversals.
- When the RSI line turns below 30, the price of the asset is considered oversold, and that signals upcoming upward reversals.
As time progressed, traders have figured out more methods to use this indicator, such as:
- Determining trends
- Finding divergences
- Confirming trends (when the RSI is combined with trending indicators
The RSI can work in many different market conditions; however, as an oscillator, it’s most useful when the market is ranging.
3. Average Directional Index (ADX)
The ADX is a very comprehensive indicator. Not only can it help traders identify market trends, but it can also help with determining trends’ strength.
The ADX has the following components:
- An ADX line, running in a range from 0 to 100. This line shows the trend’s strength.
- Two Directional Movement Indexes (DMIs), including +DI and -DI. These two lines are used to identify the market trend.
Traders often use the ADX in the following way:
- First, they use the DMIs to determine trends. When the +DI line is above the -DI line, the market’s trend is considered bullish. Conversely, when the -DI line is above the + DI line, the market’s trend is considered bearish.
- Next, they use the ADX line to determine the trend strength. A trend is considered tradable when the ADX is above 25.
The ADX works best in trending conditions.
Conclusion
Above are the 3 most useful indicators in Forex trading. As you can see, these indicators belong to different classes and have their own advantages.Therefore, which one you should use will depend on your trading style. You can also combine these indicators together to create a comprehensive trading system. To learn more about forex indicators, Easy Markets provides a series of articles that cover this topic in more depth.


 Bitcoin
  Ethereum
  Tether
  XRP
XRP  USDC
USDC  Solana
  TRON
TRON  Cardano
  Lido Staked Ether
  Avalanche
  Toncoin