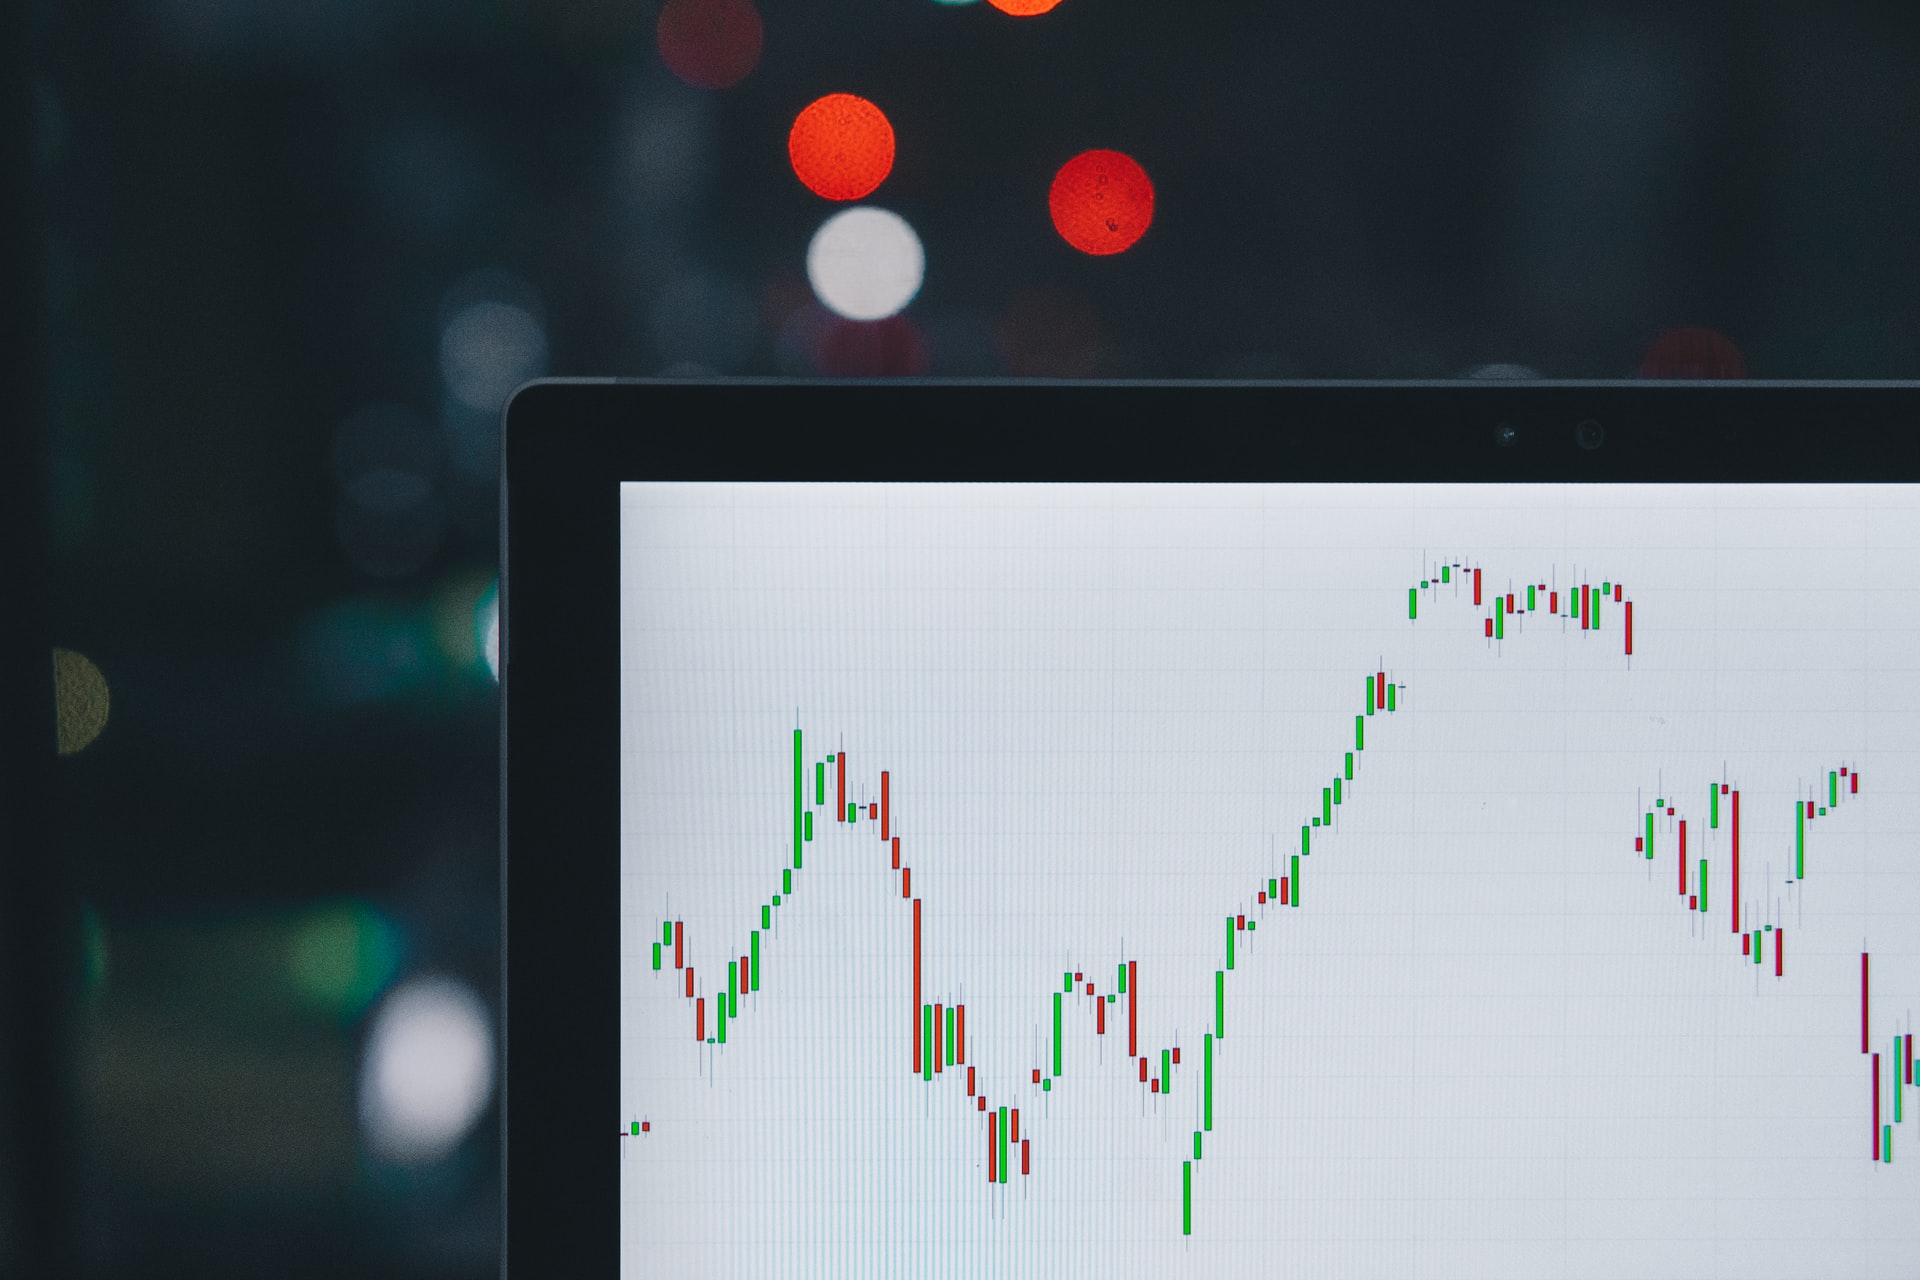
When we talk about stock and option prices, the focus is often on real-time low-latency data feeds. High-frequency trading algorithms depend on up-to-date information, and even subsecond delays disrupt trades, preventing algorithmic trading strategies from fulfilling their potential. That’s why so much time and energy is invested to ensure trading systems have the data they need, the millisecond they need it.
But algorithmic traders aren’t interested only in the now. Historical stock and option prices, alongside a host of other data, also play a critical role. Traders need to know what happened last week, last month, and even last decade, but it’s not as easy as you might think to get good quality data about the history of the stock, options, and futures markets.
Why Do Algorithmic Traders Need High-Quality Historical Data?
As an algorithmic trader, you have developed a new strategy and coded an algorithm to implement it. How do you know it works? You could set it loose on the markets to see if it sinks or swims, but that’s risky.
If you let your algorithm off the leash and there’s a coding or logic error, it might not perform as expected. But if you put too many constraints on its activity, a real-time test won’t provide the feedback you need to be confident of the new strategy.
The solution is backtesting, which tests trading algorithms on historical stock and options data. Historical data allows traders to run their algorithms over a dataset when they already know what will happen. They observe how the algorithm would have performed in the past and use that information as a guide to how it will perform in the future.
If the data is inaccurate or incomplete, backtesting is ineffective. Traders need a high-quality source of accurate historical data that includes all the asset classes, trading activity, and pricing information their algorithm uses.
Four Attributes of Useful Historical Stock and Option Data
It’s easy to find services that promise to provide historical data on a whole range of markets, but it’s not quite so straightforward to locate data of sufficient quality to support backtesting results you can be confident of.
Ideally, historical data should be:
- Accurate: Inaccurate data leads to misleading backtesting, and because it’s often challenging to verify whether data is accurate, it’s essential to get historical data from a reputable source.
- Normalized: If your data source provides messy, improperly structured data, you will have to invest significant time and effort to normalize and cleanse it before you can begin back-testing.
- Comprehensive: It’s convenient to get your historical data from a source that provides everything you need to know about a particular security. For example, if you’re interested in options, check that your historical data includes underlying prices, volume, implied volatility, greeks, surfaces, and risk slides.
- Compatible with your technology: It’s far easier to backtest your algorithms with a data source that’s compatible with your current technology stack. That might be via an industry-standard database or file format, or via an SDK that makes it easy to integrate the data source with your code and testing infrastructure.
The most accurate and consistent historical data is derived from the live market data feeds, with analytics calculated by a respected provider of high-quality market information. When you’re assessing data sources for backtesting, ensure that they conform to at least these four minimal standards.
Finding Historical Equity and Options Pricing Data
Getting quality data is critical for testing algorithmic trading strategies. Historical data allows you to determine if the strategy would have worked over a known period of time. The more accurate that data is, the more confidence you will have in the trading strategy. The less you have to do to make the data usable, the quicker you can get to the testing.
Do the research ahead of time to make sure you are getting the data you need to be confident in your algorithmic trading strategy.About the Author: Craig Iseli is the Chief Operating Officer of SpiderRock, a SaaS solution for institutional portfolio managers to implement the trading and risk management of systematic, multi-asset strategies. Their data products are used by many institutional portfolio managers to enhance trading strategies


 Bitcoin
  Ethereum
  Tether
  XRP
XRP  Solana
  USDC
USDC  TRON
TRON  Cardano
  Lido Staked Ether
  Avalanche
  Toncoin