

Bitcoin is ruling the race of cryptocurrencies and holds a price of $61,382.57 for itself as of September 2024. This analysis probes as to what makes the business now valuable, current state of market, supply metrics and future outlook. It’s important to understand these elements for seasoned traders as well as newbies who are trying to figure out how to navigate the ever-changing world of cryptocurrency investments.
Current Market Snapshot
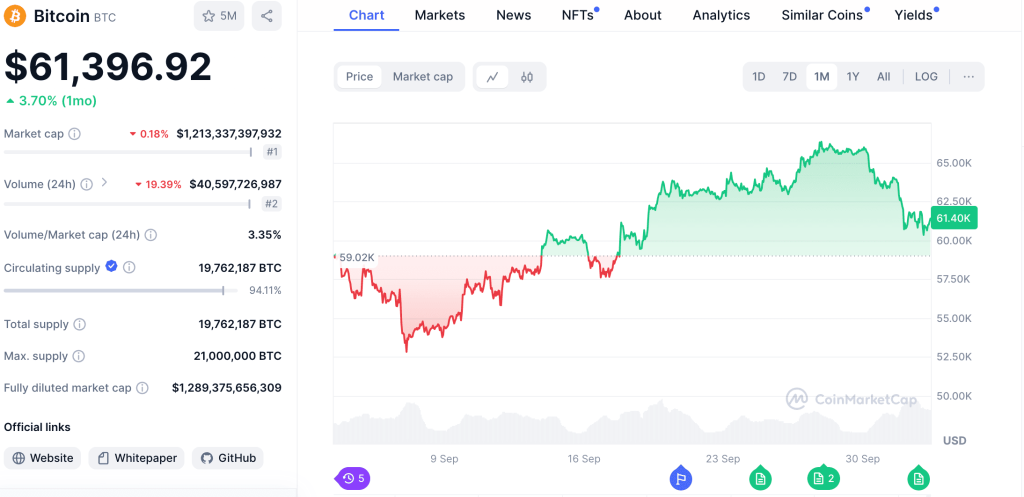
Referring specifically to Bitcoin, the monthly increase of 3.80% clearly demonstrates that there is a stable recovery phase after a bit of volatility during the beginning of the year. With a market capitalization of an incredible $1.213 trillion, Bitcoin has also cemented in the marketplace its dominance in the crypto sphere. Trading volume over the past 24 hours has been approximately $40.6 billion, a 19.38 percent increase, a sign of stronger trading activity and more investor interest.
Market Metrics
- Price: $61,382.57
- Market Cap: $1,213,053,833,728
- 24h Trading Volume: $40,587,039,545
- Volume/Market Cap Ratio: 3.35%
- Circulating Supply: 94.11% of total supply (19,762,187 BTC)
- Max Supply: 21,000,000 BTC
- Fully Diluted Market Cap: $1,289,033,977,276
Historical Context
The story of Bitcoin has been anything but ordinary. It was only launched in 2009 as a digital curiosity, but over the years it has turned into a major asset class. During the 2020-2021 bull run, Bitcoin was pushed to an all-time high amount of over $69,000 with the involvement of institutional adoption alongside increased retail interest. Bitcoin has continued to recover after a huge correction in 2022, setting itself up to move higher.
Bitcoin price analysis for September 2024:
| Metric | Value |
|---|---|
| Current Price | $61,382.57 |
| Monthly Change | +3.80% |
| Market Capitalization | $1,213,053,833,728 |
| 24h Trading Volume | $40,587,039,545 |
| Volume/Market Cap Ratio | 3.35% |
| Circulating Supply | 19,762,187 BTC (94.11% of total) |
| Max Supply | 21,000,000 BTC |
| Fully Diluted Market Cap | $1,289,033,977,276 |
| Support Level | $58,000 |
| Resistance Level | $65,000 |
| 50-day Moving Average | Rising |
| 200-day Moving Average | Upward trajectory |
| Relative Strength Index (RSI) | ~60 |
Technical Analysis
In order to know Bitcoin’s price movement, we need to analyze key technical indicators.
Support and Resistance Levels
- Support Level: Historically around $58,000, this is the psychological barrier for traders. Demands for selling could increase below this level.
- Resistance Level: The price is right at the $65,000 resistance mark. There is an opportunity for a new bullish phase if this threshold can be overcome.
Moving Averages
Using the 50-day and 200-day moving averages, we can assess the trend:
- 50-day MA: The short-term sentiment is bullish, hence the trend of this average is rising, making the average read upwards.
- 200-day MA: This longer-term average is not as smooth, showing still an upward trajectory, which indicates that the trend is not as positive overall.
When these two moving averages intersect, something called a “golden cross,” it might be a good sign of a stronger bullish phase.
Relative Strength Index (RSI)
At the time of writing, the RSI has hovered around 60, which means Bitcoin is neither oversold nor overbought. Conditions of overbought occur with values above 70; and oversold conditions would occur near values below 30. From an RSI perspective at the moment, the market is balanced and offers an opportunity to go higher.
Market Sentiment
Prices are determined by market sentiment. In recent months, the crypto market has seen a mix of optimism and caution:
- Institutional Adoption: There are still many institutions interested in Bitcoin because of its hedge against inflation and store of value potential. This is bolstered by increased regulatory clarity in many jurisdictions, enhancing investor confidence.
- Retail Interest: The increase in retail investment can be seen in the rise in wallets that hold Bitcoin. These grassroots supports can prevent prices from being as volatile due to whale sell-offs.
- Technological Developments: Innovations like the Lightning Network are making Bitcoin transactions faster and cheaper, potentially ratcheting up adoption and demand even further.
- Global Economic Factors: The sentiment of investors is strongly impacted by macroeconomic conditions, including inflation rates, interest rates, and geopolitical tensions. During uncertain economic times, Bitcoin attracts attention as ‘digital gold’.
Supply Dynamics
The supply dynamics of Bitcoin are critical to understanding its price movements:
- Circulating Supply: The supply is 19,762,187 BTC, which translates to approximately 94.11% of total supply. With the max supply capped at 21 million BTC, Bitcoin’s scarcity can drive prices higher, especially as demand increases.
- Mining Rewards Halving: The next Bitcoin halving is in 2024, with the block reward dropping from 6.25 BTC to 3.125 BTC. Typically, halvings have coincided with growth as the new coin supply becomes depleted.
Regulatory Landscape
The price of Bitcoin is still dictated by regulation. Formulating cryptocurrency regulations is at different stages around the globe. Generally, positive regulatory developments can boost market sentiment, while stringent regulations can dampen enthusiasm.
- United States: The U.S. is still in a position to play a significant role in Bitcoin regulation. Recently, Bitcoin received clarity concerning its status, being more classified as a commodity than a security, which is creating a sense of clarity around Bitcoin and boosting institutional confidence.
- European Union: The EU is moving towards comprehensive regulations that either support or stifle the market, depending on the balance between innovation and consumer protection.
- Asia: Several countries, including South Korea and Japan, are developing regulations that will foster crypto innovation, helping the crypto market to participate more actively.
Future Outlook
Looking ahead, several factors could influence Bitcoin’s trajectory:
- Technological Advancements: As blockchain technology continues to evolve and Layer 2 solutions mature, Bitcoin may well find itself becoming more useful and scalable, which could drive price appreciation.
- Institutional Investment: The trend of institutional investment is likely to continue as more companies recognize Bitcoin as a viable asset class.
- Market Sentiment: The overall sentiment surrounding the cryptocurrency market can change rapidly. Positive news can lead to upward movements, while negative developments could trigger sell-offs.
- Economic Indicators: Bitcoin’s price movements will be dependent on the state of inflation rates, interest rates, and global economic conditions. Investment in Bitcoin as a safe haven can respond to economic downturns.
The current price for Bitcoin is $61,382.57, which is a result of a mixture of emotions in the market, supply dynamics, and economic factors. To this day, Bitcoin remains a crucially important player in the cryptocurrency landscape due to its growing market and trading volume.
Technical indicators, market trends, and regulatory developments are all aspects that traders and investors should keep a close eye on. At this stage of Bitcoin’s evolution, we’re approaching critical milestones, and the prospect of large price movements is ever-present; perhaps never so much as with the next halving.

 Bitcoin
  Ethereum
  Tether
  XRP
XRP  BNB
BNB  USDC
USDC  Solana
  Cardano
  Toncoin
  Avalanche